Mass Gap (Δ)
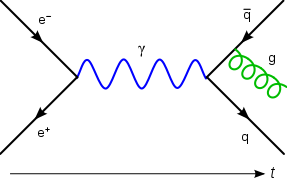
In this Feynman diagram, an electron (e−) and a positron (e+) annihilate, producing a photon (γ, represented by the blue sine wave) that becomes a quark–antiquark pair (quark q, antiquark q̄), after which the antiquark radiates a gluon (g, represented by the green helix).
FeynCalc is a Mathematica package for symbolic evaluation of Feynman diagrams and algebraic calculations in quantum field theory and elementary particle physics. Some of the features of FeynCalc are
- Passarino-Veltman reduction of one-loop amplitudes to standard scalar integrals
- Tools for frequently occurring tasks like Lorentz index contraction, color factor calculation, Dirac matrix manipulation and traces, etc.
- Tensor and Dirac algebra manipulations (including traces) in 4 or D dimensions
- Generation of Feynman rules from a Lagrangian
- Tools for non-commutative algebra
- SU(N) algebra
- Tables of integrals, convolutions and Feynman rules
- Special convolution, Mellin transform and other integral tables
- Tools for calculating 2-loop propagator-type diagrams
- FORM and FORTRAN code generation
- Translation to and from FORM
knownResult = 2*SMP["e"]^4*((s^2 + u^2)/t^2) +
       4*SMP["e"]^4*(u^2/(s*t)) + 2*SMP["e"]^4*((t^2 + u^2)/s^2);
FCCompareResults[ampSquaredMassless[0], knownResult,
     Text -> {"\tCheck the final result:", "CORRECT.", "WRONG!"},
     Interrupt -> {Hold[Quit[1]], Automatic}];
Print["\tCPU Time used: ", Round[N[TimeUsed[], 4], 0.001],
     " s."];
Today most physicists draw Feynman diagrams in a more stylized way, highlighting the topology of propagation lines and vertices. (This diagram and Figure 4 are reproduced from Feynman 1949 (by permission of the American Physical Society.)